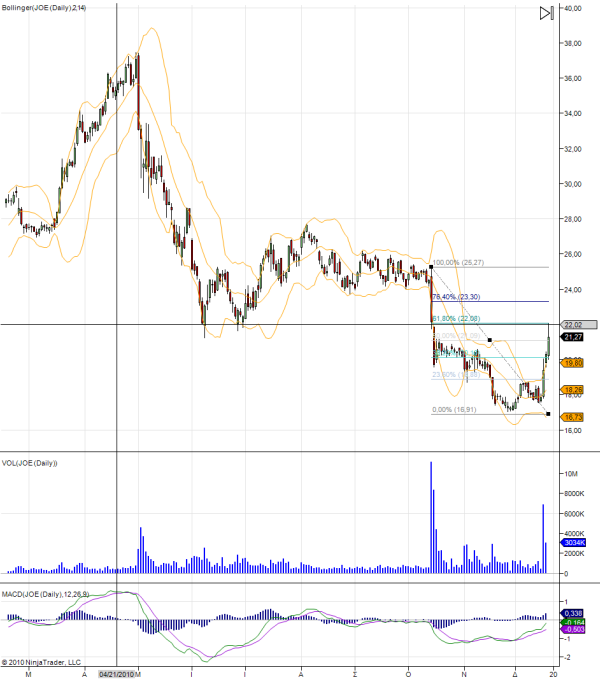
My three US stock picks today come from the real estate, retail and healthcare industries. I am looking for stock prices close to major support or resistance levels, either bouncing off or penetrating them. Fibonacci retracements and extensions are also used to verify reversal or continuation patterns, along with possible exit points. JOE and BKE stock picks are both short selling candidates for me, while MDT stock pick is considered for long trades.
The Real Estate industry of the financial sector includes the St. Joe Company, JOE, who saw their stock gain about 20% last week. However that price movement should be considered a retracement during the stock’s 12-month downtrend. Given the fact that the Friday’s candlestick just touched the support level at $22 – now a resistance one – and pulled back forming a long upper shadow, we can more safely assume that the downtrend will resume this week. Also notice the alignment of that resistance level with the 61.80% Fibonacci retracement. Setting a stop loss right above that peak means we risk less than a dollar for a possible $3 or more reward swing trading. It is also possible that the stock price might rise up to $23.50 to test another resistance level, so in that case we can enter the market again to recoup our previous losses. I will be looking for a candlestick reversal pattern in the 15-min chart though before short selling JOE stock in either case.

The Buckle’s stock of Retail industry, BKE, experienced a lot of selling pressure in the end of last week that pushed prices close to $38 mark. The candlestick formation could be defined as a reversal pattern of the 6-month uptrend. Additionally the MACD divergence also indicated the stock’s price might have peaked and is more likely to reverse, rather than continue trending upwards. Another factor which imply the BKE stock is about to consolidate or drift to lower prices is the 12-month resistance level at $40. If you are looking to trade long-term, consider short selling in the next few days, otherwise swing trading the minutes’ stock charts downwards might be proven a profitable strategy.
Medtronic’s stock of Healthcare industry, MDT, seems like it is trending upwards. Considering the fact the stock’s price penetrated the resistance level at $36.66 on Friday with a strong green candlestick and with the previous low at $35.80, MDT stock value is likely to increase the next weeks. Paying attention to hourly charts will prevent from exiting the trade inefficiently, although Fibonacci Extensions indicate future resistance levels. Two popular Fibs Extensions, 61.8% and 161.8% both align to major support and resistance levels of the past. Trading out half of the position at $40 mark and looking for a big win up to $46 seems rational. Once again reversal patterns at that levels should be valid in smaller time frames, before we trade out, otherwise we might exit a strong uptrend quite early.
Comments (No)