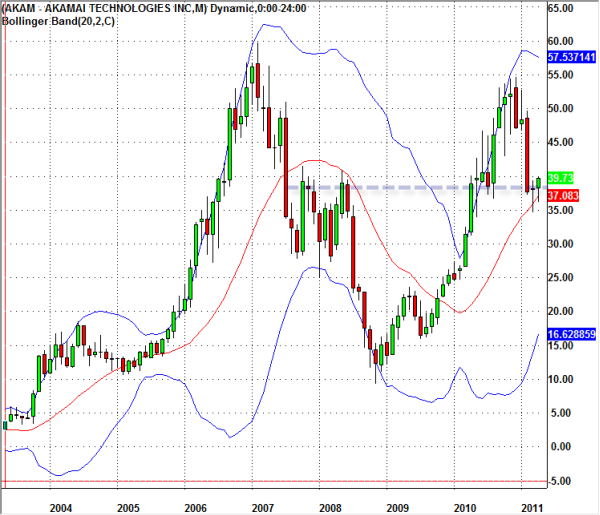
AKAM stock has found support at the most recent resistance level during 2007-2008 downtrend, adding more confidence in our trading. However one can argue that the stock graph has formed a Fail Top in the end of 2010, which could mean the uptrend has come to an end. While that may be quite likely, there’s still a good chance the stock price to try reaching again for that high. It may fail once again and it might enter into a consolidation phase by moving sideways. Why don’t we try to take advantage by this predicted movement? The odds for moving upwards to $50 are considerably higher than breaking the support level of $35 in my opinion. Utilizing the weekly and daily stock charts a position trader is able to identify better entry and exit points to make the best out of this stock pick.
Comments (No)