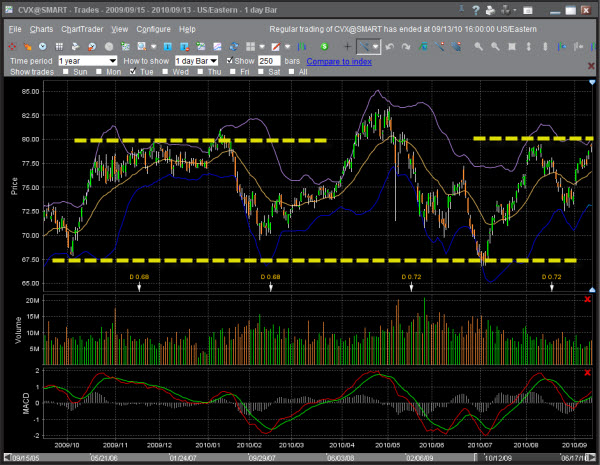
Chevron Corp, a corporation dealing with oil and natural gas, saw their share prices close at 79.25 yesterday, after opening at 79.50 which was exactly the previous 3-month high on August, 10. The daily CVX stock chart shows the stock price to fluctuate in a trading channel the last 12 months between 67.50 and 82.50. We will have to wait for today’s candlestick to either verify the resistance level, or a 3-month breakout. Personally, I’d like a fall since I have short sold at $77, risking my money up to the resistance level of 79.50.
Basic indicators of technical analysis helped to make that decision a week ago. Pinpointing that the CVX stock price is trending in a trading channel was not a difficult task. The volume at the same time constantly decreases, indicating a loss of uptrend’s strength. Apart from having a resistance level at 79.50 which was the previous 3-month high, the upper Bollinger Band also aided to define a stop loss at that level.
Upon looking at the 30-min CVX stock chart, which is something I always do after analyzing the daily chart of a stock, the share price had trouble reaching out for the upper Bollinger Band, although it traded above the moving average, which of course was expected due to the recent uptrend since late August. Additionally, the Bollinger Bands narrowed indicating a possible reversal, while the MACD divergence always adds points.
The hammer candlestick that was formed yesterday, certainly adds confidence in my trading decision, although the share prices have climbed right at my stop loss level. And when a stock price almost reaches a trader’s stop loss level, the stock trader’s psychology might change. I’ll be watching closely the CVX stock today and might trade out if the share prices break above $80.
Comments (No)