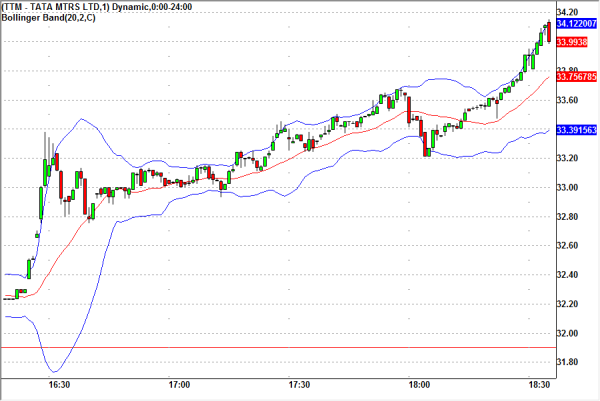
Stock graphs of longer time frames, such as the hourly or daily ones, indicated that the stock should be in a short-term uptrend. All I had to do was to point out a good entry point in the 1-min chart and keep an eye on the price and volume. As the volume picked up in the other charts, I waited for a volume peak to close the position. Additionally the hammer that was formed in the end alerted me for an imminent reversal and when the next candlestick began drawing in red, I traded out winning 40c per share. The stock price came back down to $34 and for a moment I could have been proven wrong when it climbed to 34.20. However the spectacular candlestick that moved the price 1 whole dollar down in just one minute was the perfect indication that the TTM stock was being overbought. I thought of trading TTM once more but this time short selling it. Still I don’t want to trade in such volatile conditions and opted to just watch the charts for future reference.
Since there are a lot of US stocks to trade at S&P 500, there are quite often profitable trading opportunities that just need to be found. Using a market scanner for the stocks with the biggest price range usually is a good start, but I more often than not scan the S&P 500 stocks one by one sorted by Volume. Hopefully I will find out another good stock to trade today and let you know through Twitter or Facebook page.
Comments (No)