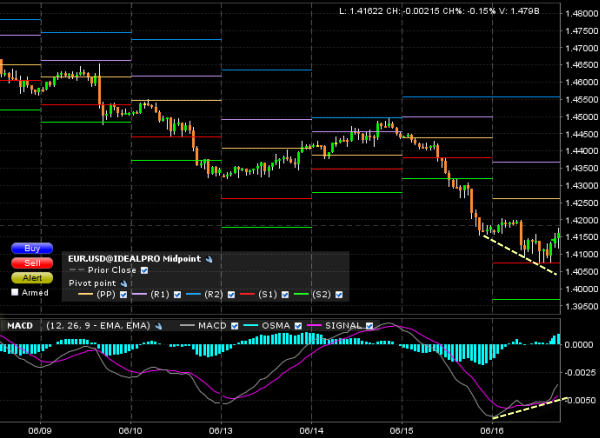
MACD divergence in addition to S1 Pivot Point provided an excellent support level for EUR/USD in the hourly forex chart. Technical analysis in forex trading pointed out a great entry point for forex traders to bet on the retracement of the currency pair after a 7-days decline. Any trader buying Euros at 1.4075 has already made about 100 pips profit or $1,000 for each traded lot, but Euro might retrace up to 1.47, the previous resistance level. The currency pair seems to have entered a consolidation phase, trending inside the range of 1.40 and 1.47. Some forex analysts are predicting that a long-term downtrend has begun since the beginning of May. Today could be the day to reconsider or at least lose some confidence in their speculation. The major support level at 1.40 can be broken, but until then I need more proof to short EUR/USD, or buy US dollars in other words!

EUR/USD Hourly chart - MACD Divergence and S1 Pivot Point
MACD is a popular indicator that has become a standard in technical analysis and quite often is a part of many forex charts. The majority of traders look for MACD crossovers but MACD divergence is even more important. MACD divergence happens when the price is uptrending and MACD is downtrending, or vice versa. In today’s example of the hourly forex chart of EUR/USD, MACD is uptrending as new higher lows are pinpointed while the pair is apparently trending downwards. MACD divergence occurred on the hidden support level of 1.4075, which is the S1 level of Pivot Points, another significant term of technical analysis. Pivot points or PP for short consist of 5 levels the majority of the time, including the midpoint level, 2 resistance levels (R1 and R2) and 2 support levels (S1 and S2). Those levels are considered as hidden most of the time, as typically there are no other signals to lead to the conclusion that the price could find support or resistance there. Of course, if such signals or indicators do exist, more importance is added to that specific level.
However those were not the only signs that EUR/USD is ending its downtrend. A triple bottom in the 15-min forex chart just 2 hours ago provided more confidence to the observant forex traders. Hopefully some of you might have caught that up! I didn’t.
EUR/USD 15-min chart - Triple Bottom
Jim: Is it correct to take the lower shadows values for Triple Bottom ?
Im asking cause I take close prices.
Well, granted it's a much more important level if the level is defined by the periods' low (open or close), but if the shadows do align at a certain price level, I consider that price pretty significant. It's like sellers can't push below that price where buyers jump in and create a lot of demand. Obviously there is something going on at that price.
Additionally if we look at charts of shorter time frames we will likely see those shadows to be candlesticks with short or no shadows.