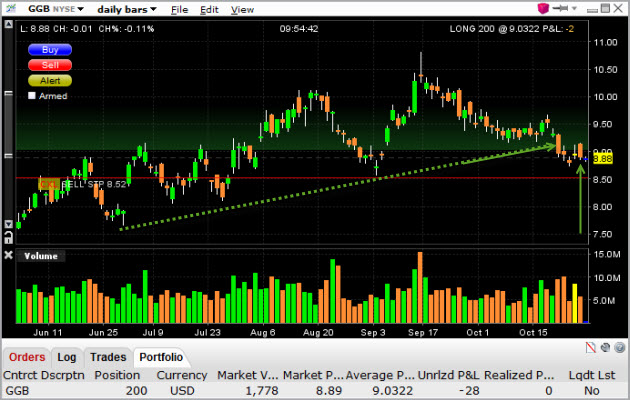
It seems that I invested in Brazilian steel industry yesterday when I bought GGB stock. Since my swing trading is greatly based on technical analysis and support and resistance levels, I wasn’t aware that I was buying shares of Gerdau SA, a Brazilian-based company engaged in manufacture and sale of steel products. That didn’t change my trade’s perspective, as I am predicting a swing up to the most recent resistance level in the daily chart for the time being.

Some traders will correctly point out that the trend line was broken a week ago. That is a sign that the uptrend might slow down or even come to a halt. Yet, that is not a reversal sign, although a breakout to lower prices will be and that is why I have set my stop loss at $8.50, having bought 200 shares for 9 dollars each. So, is that the only reason to trade GGB stock upwards?
No, the weekly and monthly GGB stock charts also favor long positions according to my analysis.
Notice the ascending triangle in the weekly chart? How about the stock healing its wounds of the 2008 plunge? Now, I can’t really predict if the GGB stock price will climb up to the all-time high of $26 or even retest the resistance level at $18. If it does, my investment will benefit greatly. However, I’ll be a happy swing trader if Gerdau shares gain 2 dollars over the next couple of months, testing for the third time the resistance level at $11. I have already placed my first profit target there, so that I trade out 70% of my position. I will let about 50 shares gain whatever the market offers in the future for my trade.
What happens in case my prediction is wrong? Lose about $100 or 2% of my trading capital and move on to trading other stocks. I only need to be correct in one out of 4 predictions of this kind, in order to breakeven, given the $2 profit per share I’m aiming in this particular trade.
Disclaimer: I’m long GGB.
Comments (No)