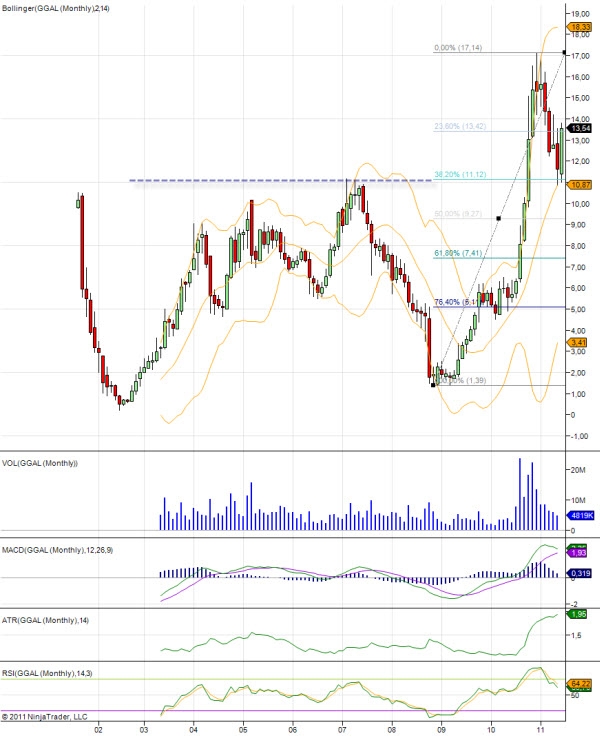
[intlink id=”1353″ type=”post”]GGAL was a stock pick[/intlink] a month ago here in Trading Graphs when the stock was trading at around $11. Grupo Financiero Galicia stock gained almost 20% during June and formed a long green candlestick in the monthly chart right on the support level, which is also the 38.2% Fibonacci retracement level! June’s candlestick has a higher high than May’s candlestick allowing me to hope for great potential in this long position. A possible profit target can be set at $14, the last resistance level in the weekly GGAL stock chart. However given the retracement, the well established support level and the candlestick patterns, I will let the trade run close to the 10-year high aiming to 5-1 reward-risk ratio!

GGAL stock: Monthly chart with Fibonacci Retracement Levels
Grupo Financiero Galicia stock was picked as one of the top ten financial stocks trading above the 50-day moving average over at Yahoo.com. Criteria for this screen have been over $1 billion market capitalization, stocks trading on an American exchange (Nasdaq regarding GGAL) and operating in Financial sector.
Disclaimer: I’m long GGAL.
Comments (No)