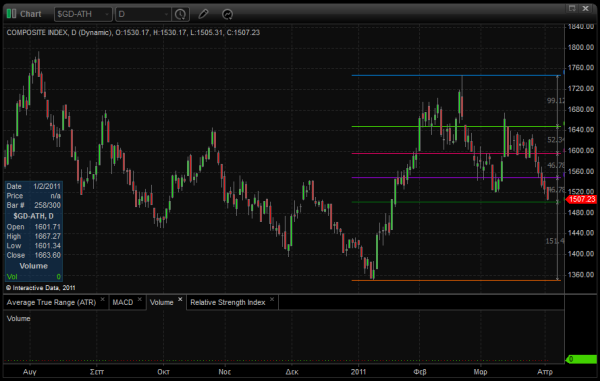
Bad news regarding the technical analysis on the Greek Composite Index daily chart is the fact there is no other apparent technical signal that the index will find a support at that level. Fibonacci retracement levels are the only indicators for an entry point, other than 1,500 being a very important figure in traders’ mind. One could argue that previous support levels at 1,500 are found in May and August 2010, but since the stock market is trending sideways, those support levels merely verify the midpoint of the trending channel. However there are still stocks that perform quite well and will generally benefit, if the composite index bounces off that level, even just for a couple of days.
Should the index verifies the support level, several weeks are required until we witness a breakout to new highs (1,800+), but until then we will watch closely whether the support level is broken or the resistance level at 1,675 is proven a major obstacle to the future uptrend. For the time being and since today everyone seems to be selling, I guess there is an opportunity for some quick profits the following days. Setting a tight stop loss on the daily chart of the stock of your choice will allow tight “take profit” levels, which are likely to be hit during the week. Taking those profits and letting a small portion (20-30%) of the position to ride free possibly taking advantage of a bigger trend without risking money by moving the stop loss up to the breakeven point, seems like a reasonable strategy.
In case you trade, be careful not to get married with your trades and end up trapped in the trending channel, which could mean prices dropping to 1,350 level.
Comments (No)