In uncertain trading times it is important to be able to see as far in front as the market will allow. The use of certain indicators alone can give traders a vague insight into what comes next in reference to what happened the last time. These can be in the form of pre-defined patterns, indicator behavior or price-action. Having an edge is the mantra of professional traders and this can be vital to being able to survive in the chaotic world of price speculation.
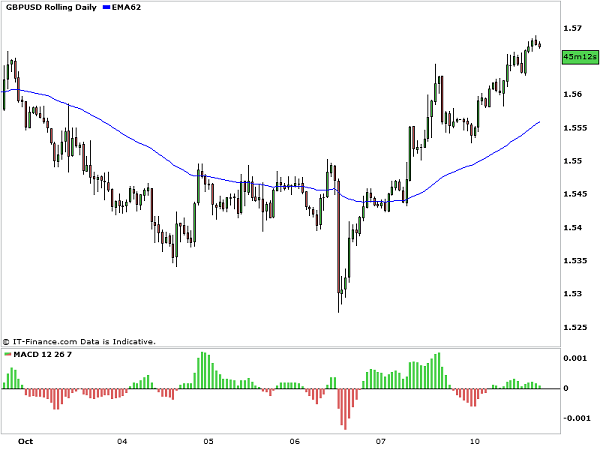
Todays charts threw up two interesting patterns which many traders would have spotted and waited for an opportunity to trade. Both of these appeared on the hourly charts and both on the GBP. The pattern in question was the humble MACD divergence and is an interesting example to understand the reliability, or otherwise, of this important indication of future price action. Lots of people trade divergence in some form or another and therefore, as well as being a particularly strong sign of price reversal, it is also has something of self-fulfilling prophecy about it. If enough people see it then chances are enough people will react to it.
Divergence is about as close as traders can get to being able to see what price will do in the immediate future. When the concept of divergence is used in trading it stands for a disagreement between what prices has been doing and how an indicator has portrayed this. It is extremely important for traders to be able to understand and recognize the existence of divergence as it can be absolutely essential in both confirming and warning against taking certain trades. Many indicators including Oscillators and MACD have the ability to display divergence and, often, these may be shown simultaneously and powerfully across multiple indicators.
The reason for its occurrence is that momentum always precedes price and therefore oscillators, being momentum indicators, will reflect a change in momentum before price has reacted to this. This is incredibly valuable to traders and is the nearest an indicator can get to accurately predicting what price will do in the future. Divergence therefore shows when momentum is decreasing but price has not yet realised, creating opportunities for traders to get ahead of the game.
There are two variations of divergence: Regular and hidden. Regular divergence is the most obvious and is incredibly easy to spot once a trader knows what to look for. The concept is very simple and the most helpful regular divergences will notably be the most obvious. The formation of divergence occurs when a momentum indicator, such as stochastic, RSI or MACD, fails to follow price offering a hint to traders that it may not agree with the current situation. When price moves to a lower low but the MACD makes a higher low than its previous lows it can become a signal that momentum is slowing and that the price at its current low may be unsustainable.

Divergence on 1-hour GBP/USD chart
In today’s scenario they were both good examples of regular divergence. Although some traders will say that higher timeframes, such as daily or weekly, offer more reliable signals, the truth is they can also take a very long time to react to divergence. Successful hourly timeframe divergences are interesting and profitable because they occur and complete within a few days. As today’s GBP/USD and GBP/JPY show, there was a clear divergence between price and the MACD. The extent to which it will play out will become evident within the next 48 hours.
Divergence on GBP/JPY chart
I really hope the market starts to balance out again I’m having trouble landing a winning trade here lately.