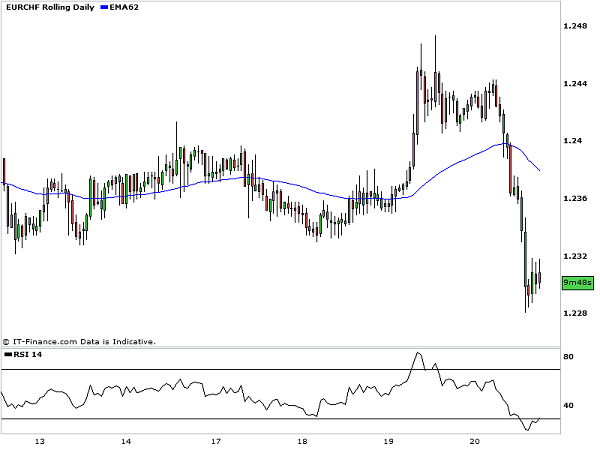
RSI is a momentum indicator and belongs to the family of oscillators which can help traders to determine whether a stock, currency or commodity is likely to continue or reverse from its current trend. Developed by Welles Wilder as a tool to help predict price reversals, the RSI forms a very important trading tool for technical trend analysis and can be incredibly useful to help determine a good time to enter or exit a trade. It provides traders with an insight into the strength of price relative to the underling market and, although it does not generate clear-cut trading signals, it can be an invaluable tool in pinpointing potential market reversals.
The importance of the RSI for most traders lies with its ability to assess whether a currency can be considered over-bought or over-sold. By this it means that it may give an indication of when a market may consider the current price as either too high or too low and allows traders to anticipate a reversal or correction from this price. The hourly EURCHF chart shows that price has hit an oversold area after some very steep declines throughout the day, traders could look for further signals to confirm that a rally may be on the cards. The key factor in reading this indicator is to observe that when price falls below 30 on the scale it is considered by many to be over-sold and due an increase in price, conversely, when it rises above 70 it can be seen to be over-bought and therefore too high in price. However, as with all momentum indicators it would not be wise to simply trade when price hits these areas but to look for a confluence with other indicators.

Welles Wilder stated that perhaps the most useful application of the RSI was, like many oscillators, its ability to reflect divergence between the RSI line and chart price. Divergence often occurs when a market is about to reverse from its current trend. The beauty of momentum oscillators such as the RSI is that they are ‘leading indicators’ as opposed to lagging. Therefore they have a tendency to pre-empt market moves and give signs of price changes before the event. This is incredibly helpful when, for example, price is reaching new highs yet the RSI is not showing a new high. Often the RSI and price are in tandem but when they move out of synch like this it becomes clear to traders that the strength of the price is no longer supported by the indicator. This gives a very high probability that price will reverse, or at least correct, from its current extreme.
The fact is that a lot of traders watch the RSI to establish when and when not to trade. As a result, the RSI and other popular momentum oscillators become something of a self-fulfilling prophecy. If enough people are in agreement that a stock, currency or commodity is overvalued then price is very likely to change. Professional traders and chart analysts frequently refer to the relative strength of a stock, currency or commodity in assessing whether price may be sustainable or set to decline or rise. For this reason alone, the RSI is incredibly important and a valuable tool for traders to use in their analysis of the potential to trade a market. Due to the fact that the RSI has the potential to stay in its over-sold and over-bought extremes for some time before reversing it is not advised to be relied on for accurate trading signals but more as a guide to the sentiment of the market.
Comments (No)