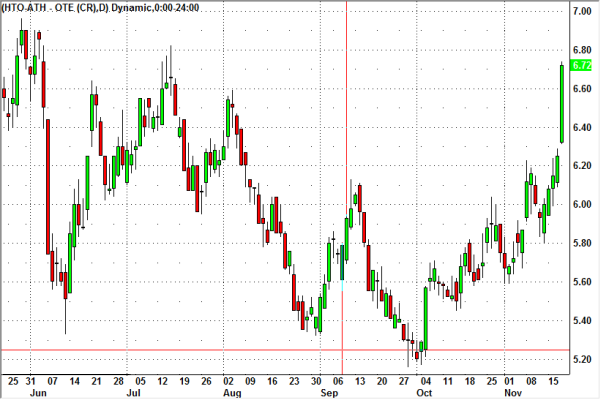
A swing trading system deals with entering and exiting right on key points mainly inside an already established trend. It is not that often to swing trade when you expect a trend reversal. Yesterday HTO stock overcame the resistance level found in the 60-min graph, which was also the 3-month high. The continuous higher lows also indicated the HTO stock price was ready to reach new highs. That is why I immediately bought 2.000 shares at 6.19 setting a stop loss at 5.95. Initially I thought of a stop loss at 6.05, but given the fact the Greek stock market behaves a bit erratically, I opted for a less tight stop loss.
Today the HTO stock opened with a gap and formed a great green candlestick in the 60-min graph while it also broke the resistance level at 6.60! Since there isn’t a worrying candlestick formation at this point I’m holding the position until the stock prints a lower price than the previous candlestick’s low in the 60-min graph. Maybe the best entry point regarding a perfect swing trading system would have been at the breakout of 6.00 on 8th of November but I kind of neglected that signal. I should finally note that the HTO stock is trading downwards in the monthly chart, but it has obviously entered an upswing even at that timeframe.
HTO is commonly used to buoy the market when the banks are taking a hit. FTSE ASE 20 was dangerously hovering around the 700 mark and a drop below here may have set off aggressive selling.
Perhaps the 7.50 mark as indicated on the weekly chart may be next resistance.
Nice trade.
Great useful & informative post about stocks.